
Some Data on Stock Market Declines
Every time we have some big down days in the stock market, too many people immediately start talking about the next crash and big losses. At such times, it is helpful to take a look at the data. This blog post is a good summary of the data on corrections and bear markets, including how often they occur and how deep they are. The key fact is that real crashes are rare and are accompanied by recessions or financial crises.
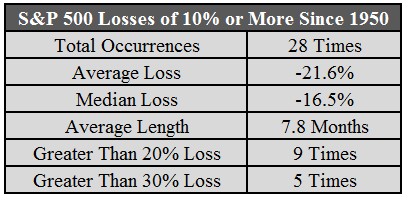
I looked at the S&P 500 data going back to 1950 and found that there have been nearly 30 instances when stocks fell by 10% or more, roughly once every two years (go back to 1928 and it happens around once a year).
In that time stocks have only fallen 30% or more five times. It happens, but it’s rare. That’s one out of every thirteen years. Here are the rest of the stats on the double digit losses:
You can see the average double digit loss lasted almost 8 months and led to a bear market. The huge losses are the exception, not the rule. Two-thirds of the time, when the market falls by double digits, it’s down by less than 20%. About half the time it’s down less than 15%.
![]()

Related Posts:
- Know the Differences Between Social Security Spousal and Survivor Benefits
- Know the Differences Between Social Security Spousal and Survivor Benefits
- Spouses and Social Security: Resolving the Confusion About Spousal and Survivor’s Benefits
- How Working Past Age 62 Can Change Your SS Benefits
- How Working After 62 Can Change Your Social Security Benefits


